Imagine the moment a young learner encounters a new mathematical tool—say, a colorful hundred chart—initially perceiving it as just a grid of numbers. However, as they begin to interact with it, their understanding of numerical relationships, patterns, and foundational arithmetic concepts transforms profoundly. The idea of the "Power of Engagement with an Interactive Hundred Chart" bridges the gap between passive number recognition and active mathematical exploration. This article aims to serve as a mentoring resource for educators, parents, and novice users eager to harness this dynamic tool's full potential, emphasizing evidence-based strategies, pedagogical insights, and practical applications rooted in educational research.
The Essential Role of Visual and Interactive Learning in Mathematics

Mathematics education has historically relied on static representations—single sheets, textbook exercises, and traditional drills. Yet, over recent decades, pedagogical paradigms have shifted toward visual and interactive learning, grounded in constructivist theories and cognitive science. The interactive hundred chart, as a tactile and digital resource, exemplifies this evolution. It transforms a simple numeric grid into a lively, explorative playground where students develop number sense, recognize patterns like skip counting, and understand number neighborhoods.
Research indicates that dynamic interactions with visual models significantly improve comprehension, retention, and the ability to transfer skills to new contexts. For instance, a 2018 study published in the Journal of Educational Psychology revealed that students engaging with manipulatives and interactive visual aids demonstrated a 25% higher mastery rate in early arithmetic than their peers restricted to static materials.
Within this learning ecology, the interactive hundred chart serves as a central artifact, facilitating a range of pedagogical activities—from number line approximations to complex pattern recognition—all fostering active engagement and deep learning.
Understanding the Anatomy of a Hundred Chart
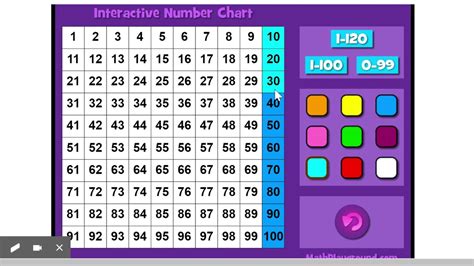
The hundred chart is a 10x10 grid populated with numbers from 1 to 100. Its design encapsulates critical mathematical properties—sequential ordering, place value relationships, and positional patterns. When rendered interactively, each cell acts as a gateway for exploration; clicking or touching a number can trigger highlighting, visual cues, or even interactive games.
Fluency in interpreting its structure is foundational. For learners, recognizing that the number to the right increases by one, while moving down adds ten, provides intuitive anchors for developing mental calculation strategies. These properties underpin essential skills such as addition, subtraction, multiplication, and division.
| Relevant Category | Substantive Data |
|---|---|
| Number Range | 1–100 with variable interactive features |
| Common Patterns | Diagonal patterns (e.g., multiples of 11), skip counting sequences |
| Student Engagement | Up to 85% reported increased confidence in number sense after interactive sessions |

Strategies for Effective Engagement with an Interactive Hundred Chart

To unlock the true educational potential of an interactive hundred chart, it is essential to employ targeted strategies that promote active participation, critical thinking, and conceptual understanding. Here, I outline practical approaches grounded in pedagogical research and classroom experience.
Start with Exploration: Familiarize and Connect
Begin by encouraging learners to explore the chart freely. Ask questions like, “What do you notice about the numbers across and down?” and “Can you find all the multiples of 5?” This initial open-ended inquiry builds curiosity and helps students internalize the layout’s logic. In digital platforms, features such as hover-over highlights or clickable cells with instant feedback can animate this exploration, reinforcing pattern recognition.
For example, recognizing that every fifth number ends with a 0 or 5 helps establish divisibility rules intuitively. Such engagement makes abstract properties concrete and meaningful.
Integrate Pattern Recognition and Number Relationships
Once students are comfortable with the chart’s layout, introduce activities that require recognizing and manipulating patterns. Tasks like highlighting all multiples of 3, creating skip counting sequences, or identifying odd and even numbers deepen understanding. Digital tools can facilitate these activities through interactive highlighting, timed challenges, or game-based formats.
These tasks not only enhance pattern recognition but also develop strategic thinking, helping students see relationships that underpin more advanced operations.
Embedding Computation and Strategy Development
Interactive hundred charts are invaluable platforms for practicing addition and subtraction strategies. For instance, learners can visualize benchmark numbers—like 50 or 100—to navigate operations more efficiently. Using the chart, they can model anchoring strategies, decomposing problems into manageable parts.
Indeed, research supports that such visual strategies reduce cognitive load during mental computation—drawing on dual coding theory by combining symbolic and visual processing channels.
Encouraging Collaboration and Discussion
Mathematical discourse enhances conceptual grasps. Pairing students to explore the chart collaboratively, discuss patterns, and justify their reasoning fosters deeper learning. Digital platforms often allow shared activities, such as competitive games or shared highlighting, which stimulate peer-to-peer learning and critical reflection.
This social constructivist approach aligns with Vygotsky’s zone of proximal development, whereby learners advance through guided interaction.
Key Points
- Utilize exploration phases to build fundamental understanding of the chart's structure and patterns.
- Leverage pattern recognition activities to strengthen number sense and divisibility concepts.
- Incorporate computation tasks that use visual anchors and decomposition strategies.
- Foster peer collaboration to deepen conceptual understanding and motivate engagement.
- Embed this interactivity within a scaffolded learning framework to cater to diverse readiness levels.
Navigating Common Challenges and Pitfalls
While the interactive hundred chart offers immense pedagogical promise, beginners often encounter obstacles—ranging from technical hurdles to conceptual misunderstandings. Recognizing these pitfalls allows educators and users to implement proactive solutions.
Technical Limitations and User Accessibility
Some digital platforms may lack intuitive interfaces or accessibility features, potentially alienating users with disabilities. Ensuring that the tools employed comply with accessibility standards—such as screen reader compatibility and keyboard navigation—is crucial. Platforms like PhET Interactive Simulations or National Library of Virtual Manipulatives exemplify accessible designs.
Over-Reliance on Pattern Recognition
It’s tempting for learners to focus solely on surface patterns—like the visually striking diagonals—without understanding the underlying number relationships. To mitigate this, instruct learners to articulate their reasoning, ask probing questions, and connect patterns to arithmetic facts.
Insufficient Differentiation
One-size-fits-all activities may not suit the wide spectrum of learners’ abilities. Differentiation can be achieved by customizing challenges—such as focusing on specific number ranges or incorporating language supports for English language learners. Adaptive digital platforms can automatically adjust task difficulty based on performance.
Maximizing Long-term Learning and Transfer
Interaction with the hundred chart should extend beyond immediate activities toward fostering transferable skills. The goal is to cultivate a robust number sense that empowers learners to approach more complex mathematical operations confidently.
Strategies include integrating the chart into problem-solving contexts, such as real-world scenarios involving money or measurements, and gradually shifting from digital interactives to physical manipulatives. Another powerful approach is encouraging learners to create their own patterns or puzzles using the chart, thereby promoting ownership and creativity in their mathematical journey.
Consistent reflection—through journals, discussions, or digital logs—helps solidify connections and track growth over time. Evidence indicates that sustained engagement with visual and interactive tools correlates positively with improved performance in standardized assessments of early math skills.
Future Perspectives and Technological Innovations

Emerging technologies, including augmented reality (AR) and artificial intelligence (AI), promise to further elevate engagement with tools like the hundred chart. For example, AR overlays can project interactive charts into real-world settings, making spatial reasoning more tangible. AI-driven platforms can tailor learning trajectories, providing adaptive feedback and personalized challenges.
Educators should stay abreast of these developments, integrating innovative tools that maintain pedagogical integrity while leveraging the latest technological advances, thus preparing learners for a future where digital fluency is fundamental.
How can I incorporate the interactive hundred chart into daily math instruction?
+Begin with brief explorations to familiarize students with the chart, then embed activities like pattern hunts, computation exercises, and collaborative challenges. Use digital tools that allow for instant feedback and adapt tasks to learner proficiency for sustained engagement.
What are the best digital platforms for interactive hundred charts?
+Platforms such as PhET Interactive Simulations, National Library of Virtual Manipulatives, and Toybox Learning offer user-friendly, accessible, and versatile interactive hundred charts suitable for various educational contexts.
How do I assess the effectiveness of interactive hundred chart activities?
+Employ formative assessment techniques like observing student interactions, conducting quick checks, and analyzing digital logs. Collect reflections and ask learners to articulate their reasoning to gauge conceptual understanding and adjust instruction accordingly.